Know your PostgreSQL health before it breaks
pg-collector streams live PostgreSQL telemetry into a 7-dimension state machine that predicts failures, detects query regressions, and answers the 5 questions every DBA asks — automatically.
Edge-deployed collector. Rich telemetry. AI-powered predictions.
Overall Health
Stable for 14 days
7-Dimension State Vector
Hysteresis State Machine
5 answers every DBA needs
Not dashboards. Not metrics. Answers. The state machine assembles signals from 7 health dimensions, query intelligence, and 30-day baselines into pre-built verdicts.
Is my database healthy?
Single-sentence verdict with confidence level, time-in-state, and 7-dimension breakdown. No interpretation needed.
What changed?
Causal narrative linking state transitions to query regressions, workload shifts, and configuration changes with timestamps.
What will break next?
Ranked risk register with 'days to breach' projections. Vacuum wraparound in 18 days. Connection exhaustion by April 12.
What caused this spike?
Root cause attribution chains: query workload change -> cache eviction -> checkpoint storm -> lock cascade. Automatic cross-dimension correlation.
How is performance trending?
30-day health report with per-dimension trajectories, volatility metrics, week-over-week comparisons, and prediction accuracy tracking.
Built for production PostgreSQL
Edge-deployed collector streams metrics every 5 minutes. Rich telemetry stores the history. AI predicts what happens next.
7-Dimension Health Vector
Cache, transactions, vacuum, locks, replication, connections, I/O — each scored 0-100 with weighted composite.
Hysteresis State Machine
5 health states with configurable sustained-change rules. No alert flapping. Recovery is slower than degradation — by design.
Daily AI Predictions
AI analyzes your health evidence pack daily. Self-referential: compares to yesterday's prediction and tracks accuracy over time.
Query Drift Detection
Tracks execution time vs 7-day and 30-day baselines. Classifies as stable, drifting, drifted, or regressed.
N+1 Query Detection
Finds ORM-generated single-row loops automatically. Shows estimated call reduction and fix suggestions.
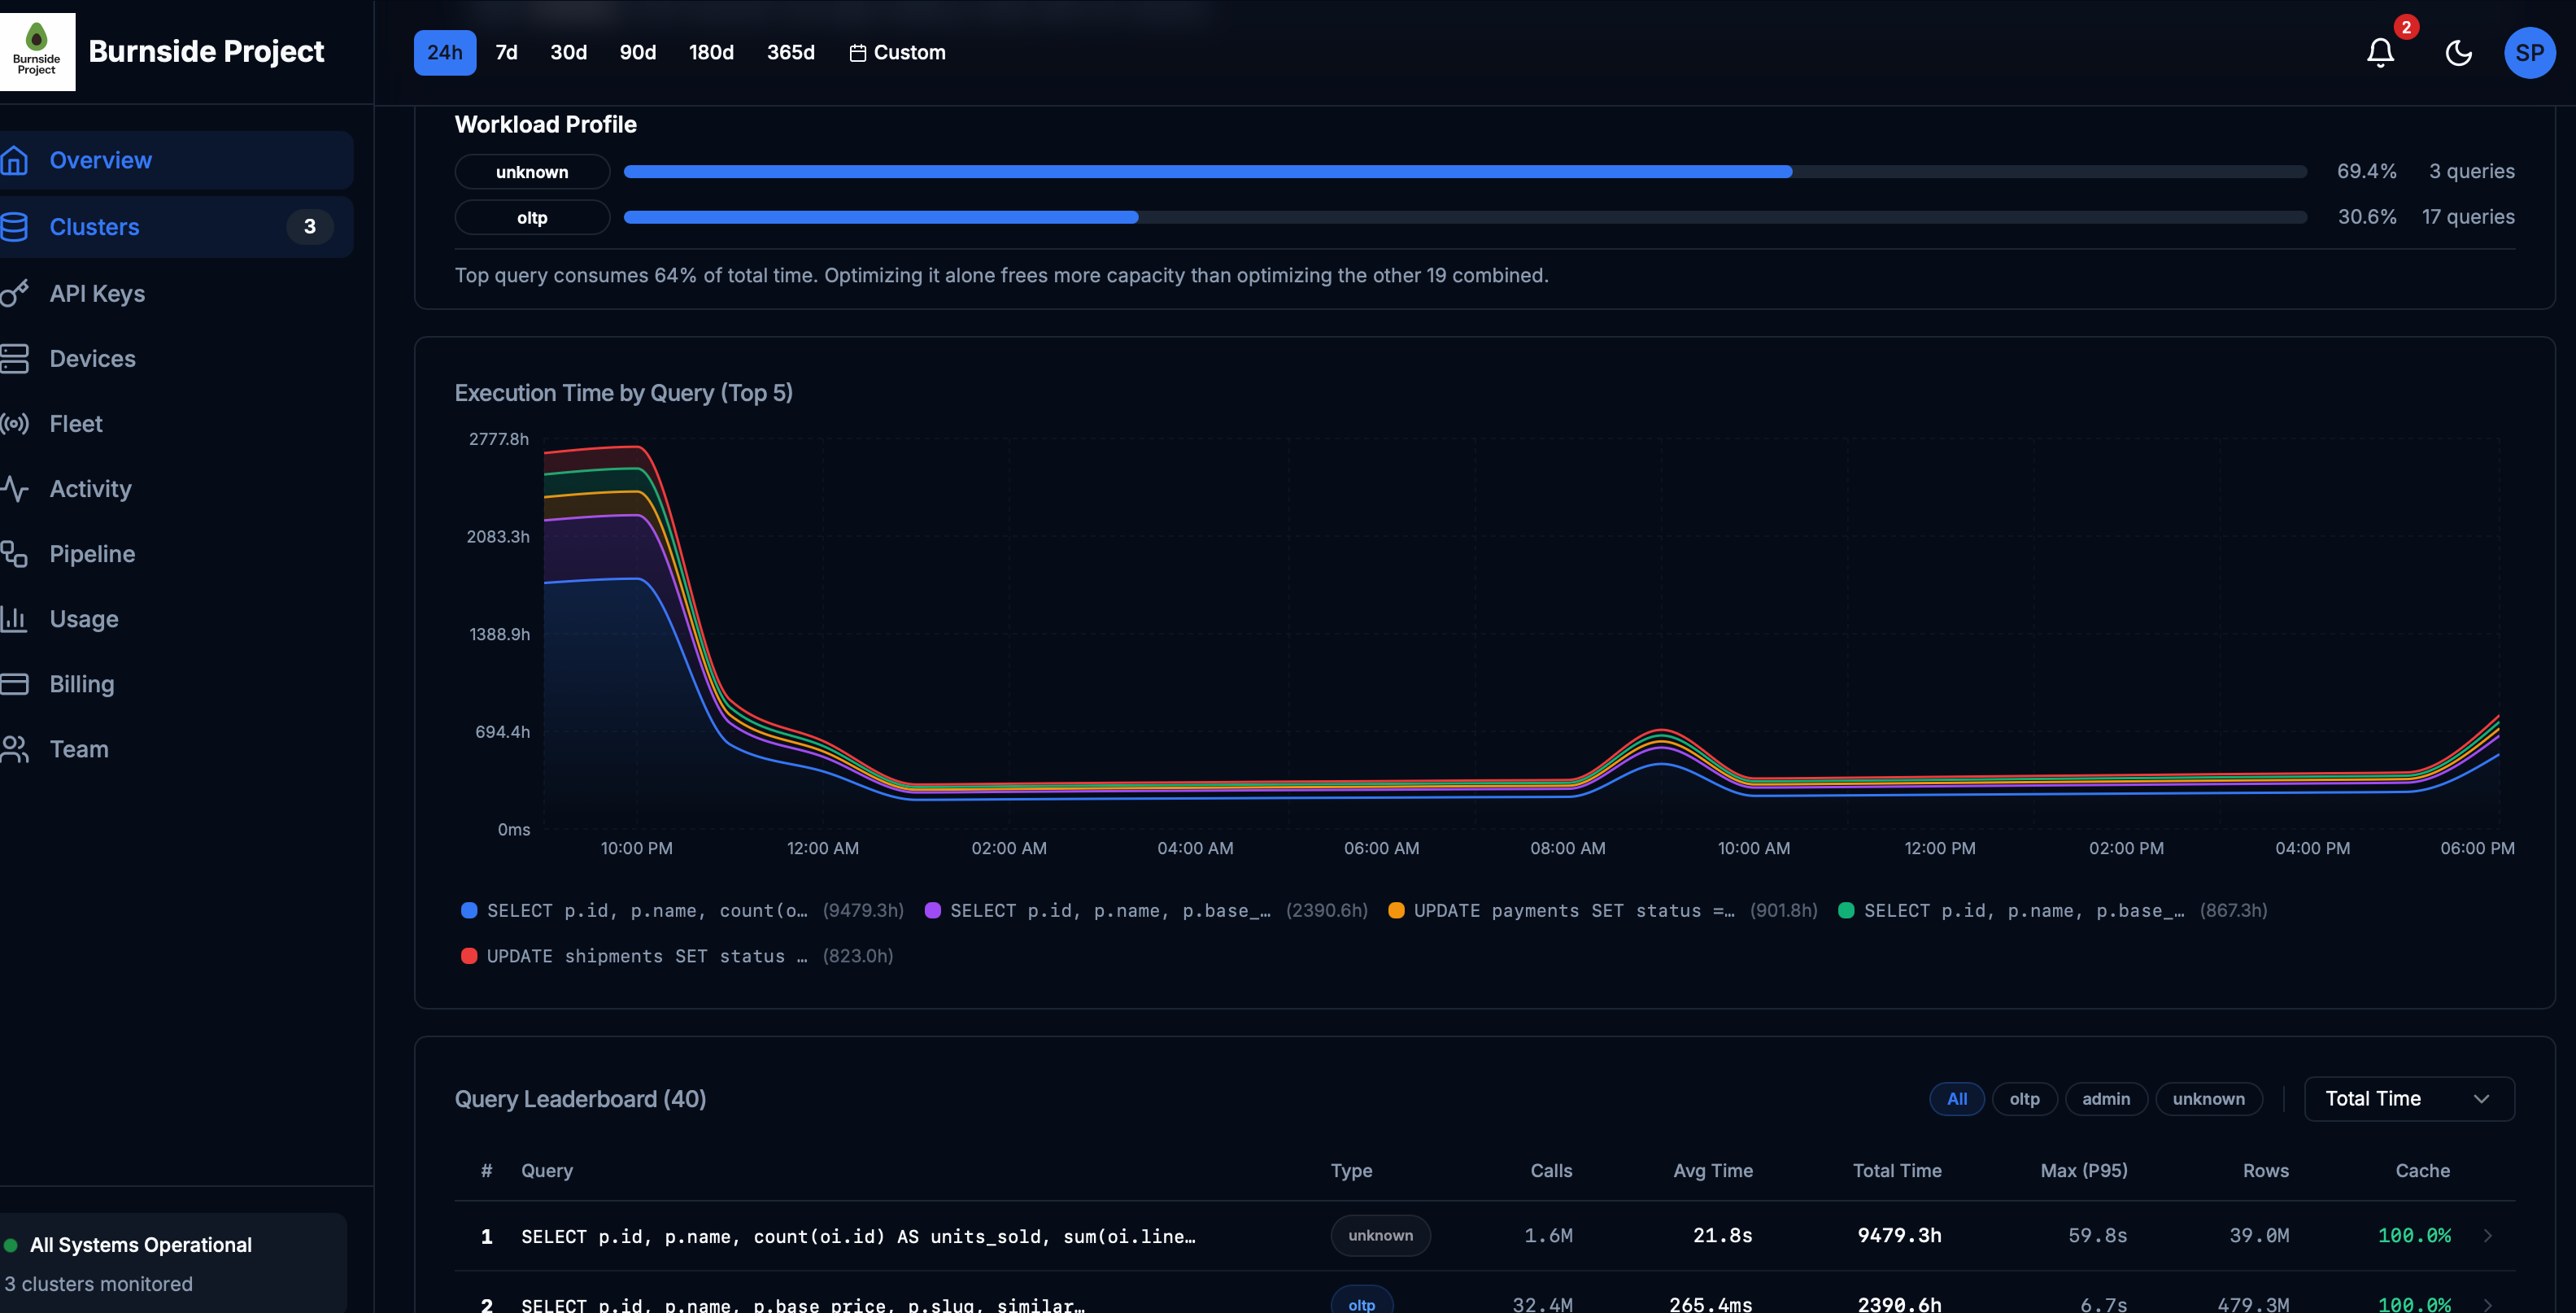
Workload Profiling
80/20 cost distribution across OLTP, analytics, and maintenance. Find the one query consuming 73% of your capacity.
Plan Change Detection
Infers index-to-seq-scan flips, hash spills, and generic plan regressions from shape metric deltas — no EXPLAIN needed.
Temporal Baselines
Time-aware normals: business hours, off-hours, weekends. Your database behaves differently at 3 AM — we know that.
Rich Telemetry Store
Months of historical metrics at your fingertips. Hourly rollups, trend baselines, and drift comparisons — query any time range instantly.
Every query tells a story
Shape metrics reveal WHY a query slowed, not just that it slowed. Rows per call increased? Table growth. Blocks per row jumped? Lost an index. Temp blocks appeared? work_mem exhaustion.
$ curl -s /api/v1/clusters/abc/state | jq
{
"overall_health": 87,
"state": "normal",
"verdict": "Healthy. Stable for 14 days.",
"dimensions": {
"cache": 94, "vacuum": 88,
"locks": 91, "replication": 95
}
}
Three layers, one answer
Deploy the collector. We handle the rest.
Edge Collector
Lightweight Go agent runs next to your PostgreSQL. Streams pg_stat_statements, locks, vacuum, replication, WAL — every 5 minutes. Zero config.
Rich Telemetry
Metrics flow into a high-performance analytics engine. Hourly rollups, tile scores, and drift baselines computed automatically. Query months of data instantly.
AI State Machine
7-dimension health vector with hysteresis transitions. AI builds daily predictions from the evidence pack. Self-referential accuracy tracking.
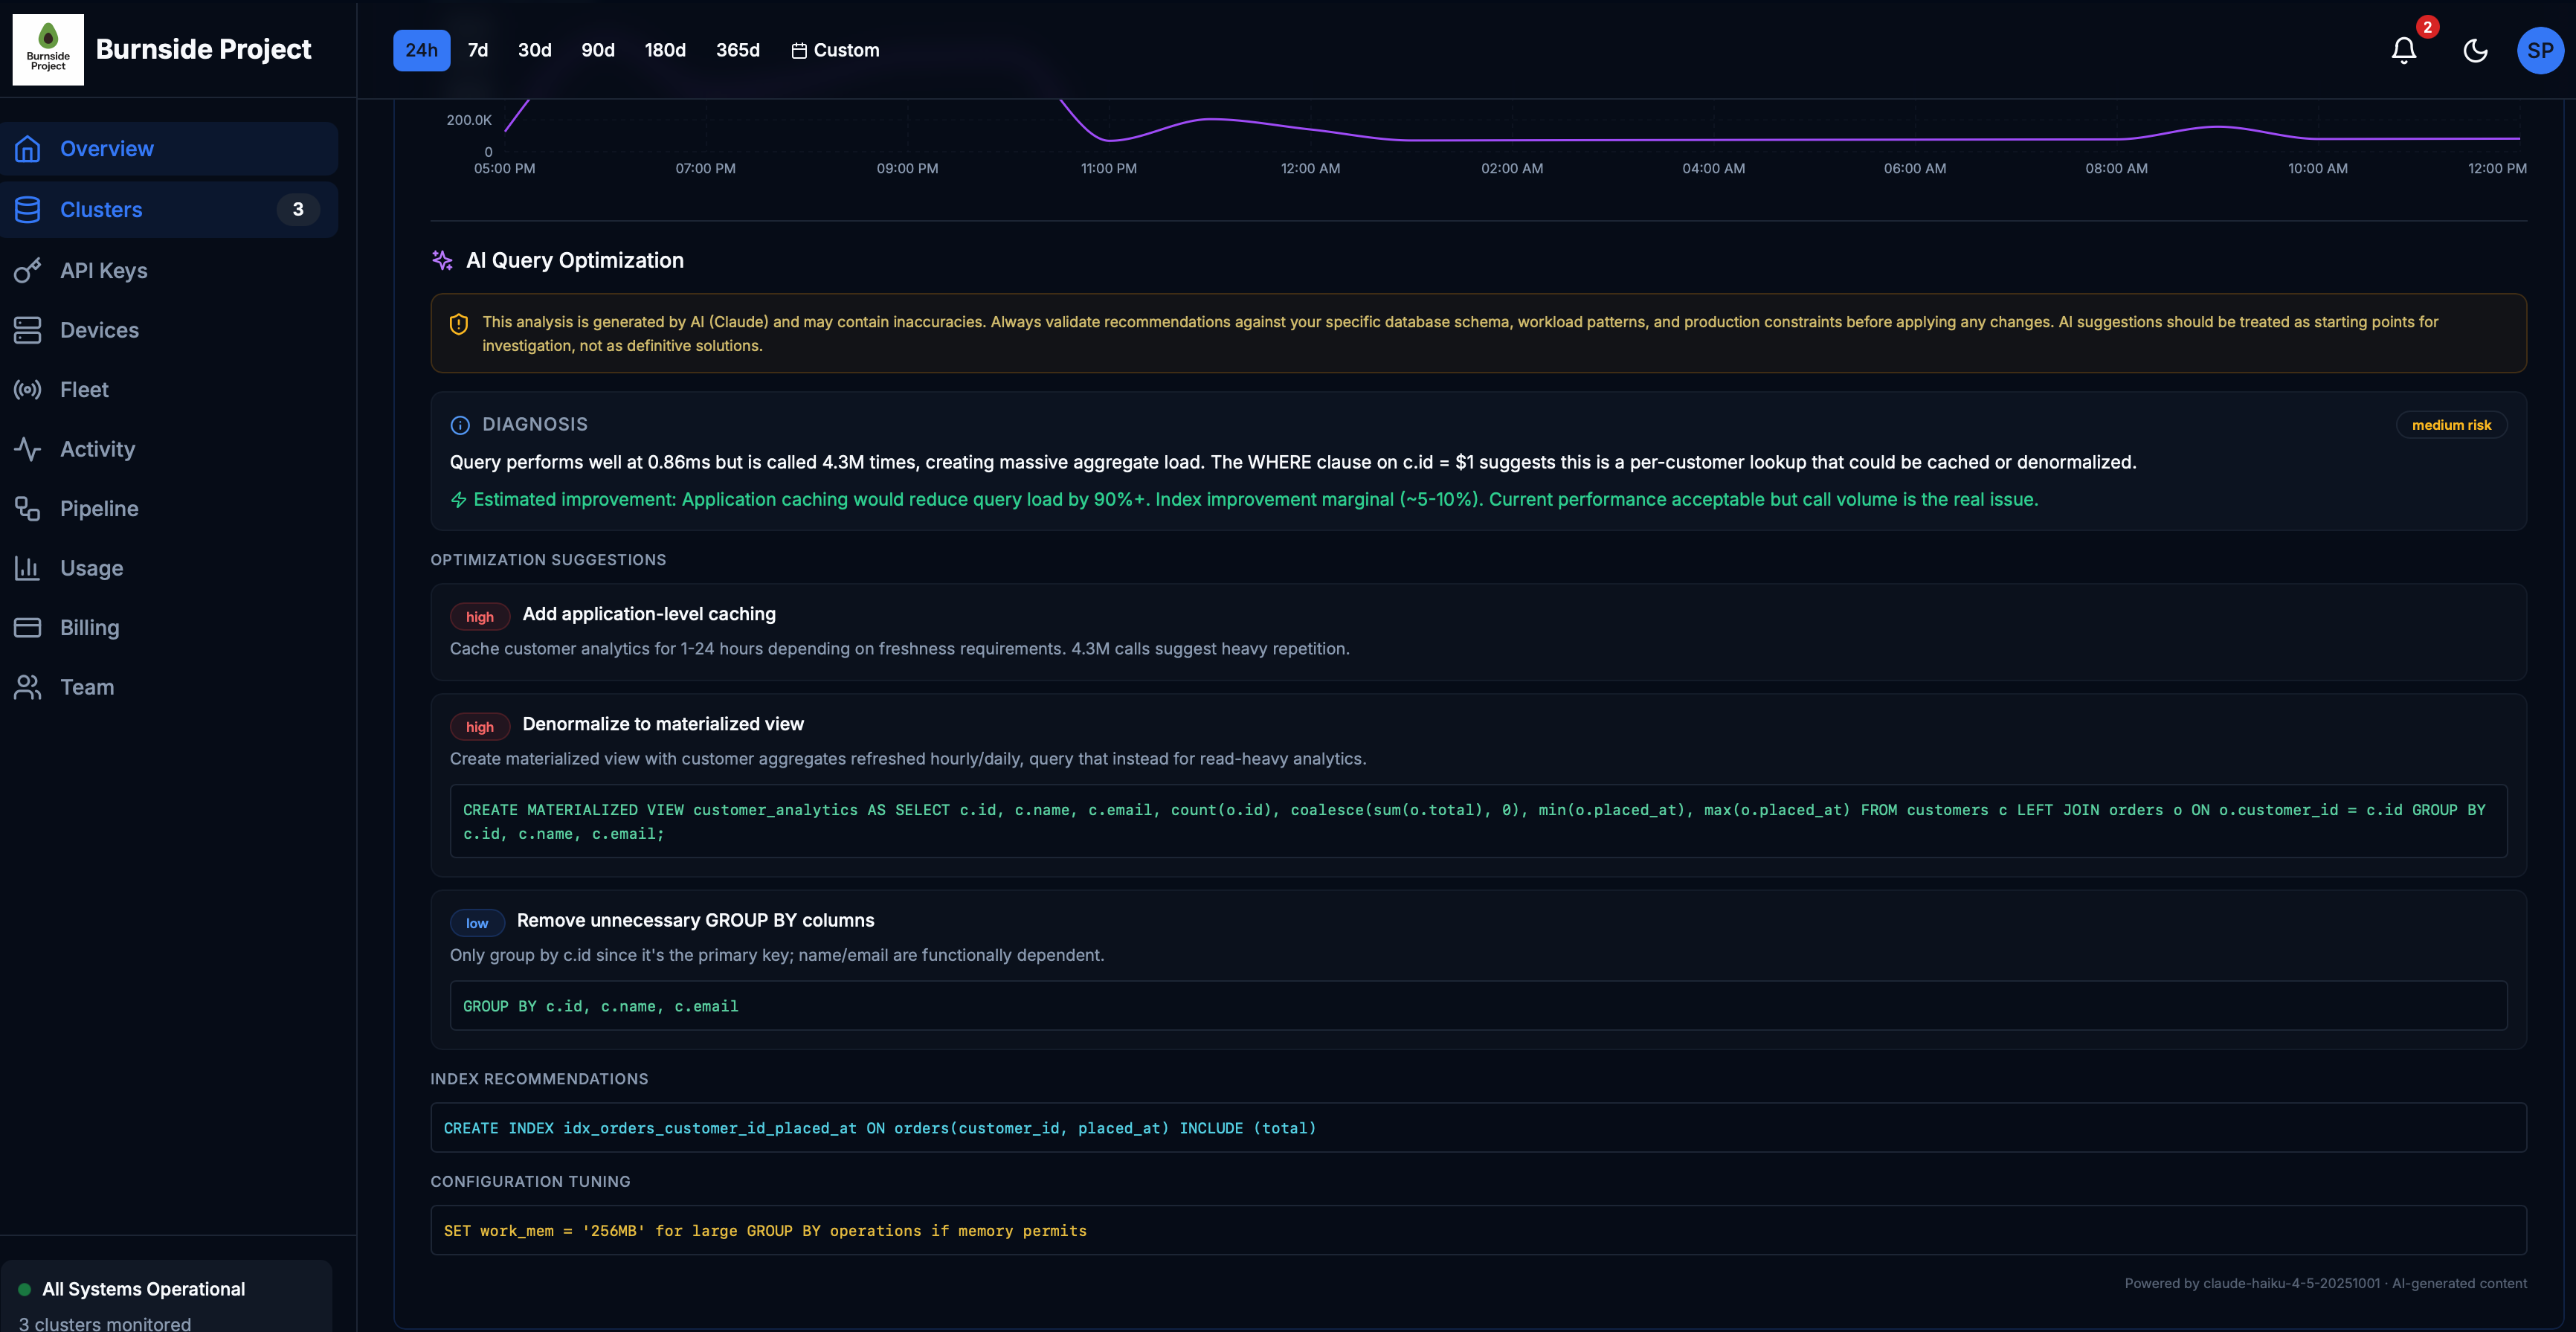
Not just monitoring — actionable fixes
AI diagnoses your slowest queries with specific SQL recommendations. Index suggestions, materialized views, configuration tuning — all generated from your actual workload patterns.
Estimated query load reduction with AI-suggested caching
Daily AI health predictions with self-referential accuracy
EXPLAIN access needed — detects plan changes from metric signatures